Soilsinew Soil Remediation

SOILSINEW® SOIL REMEDIATION
- With a highly concentrated bacterial blend of microorganisms that remediate heavy metal in the soil, as well as organic substances and other trace elements, Soilsinew® Soil Remediation significantly reduces contamination from fuels, solvents, fractals, oils, greases and other petrochemical hydrocarbons, as well as organic hydrocarbons.
- When combined with the parameters of your specific site, and our nutrients, we can mitigate the impact of these contaminants with a workable plan that will efficiently, and positively, impact your site.
DESCRIPTION

BENEFITS OF SOILSINEW® SOIL REMEDIATION:
- Improved uptake of plant nutrients through accelerated mineralization of organics in the soil
- Plant photosynthesis Increased
- Uptake of phosphorous greatly improved
- Both yield and production of crops greatly improved
- Microbial biodiversity and soil health are both improved significantly
- What would normally take 10 years, a 66% increase in SOC (soil organic compounds), is accomplished in 6 months.
HOW SOILSINEW® SOIL REMEDIATION INCREASES SOIL ORGANIC MATTER:
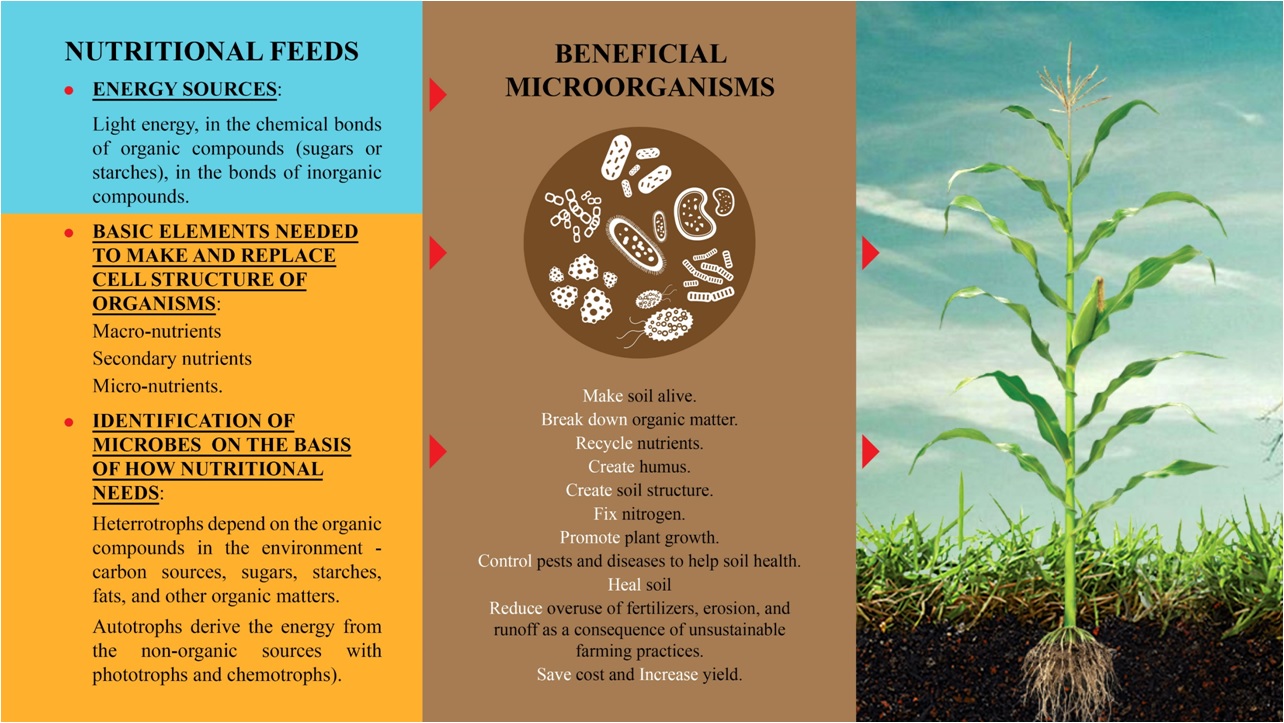
- Scientists agree that, when it comes to technology, nothing can beat naturally occurring soil microbes, which are capable of improving carbon sequestration in the soil as well as improving the soil’s capacity to store CO2.
- At the time of the writing, between 44% and 57% of all CO2 emissions are created by conventional and industrial agricultural practices. This has had a great detriment on the soil, where beneficial soil microbes have been reduced to a paltry, unhealthy 1000 to 5000 CFUs (colony forming units) per gram of soil.
- Although the time-frame is not optimal, the comparison of organically farmed silt loam soil to conventional methods is astounding; in a 12 to 15 years time-span, upwards of 1 MILLION CFU’s per gram of soil can be achieved.
- Today, we can achieve those levels in 30 days or less, and industry first, generating massive colonies of microbes using our microbial fertilizer that are both regenerative and sustainable, and produce upwards of 1 Million CFU’s in less than a month’s time.
INCREASING SOIL ORGANIC CARBON: (CONT.)
- Our microbial fertilizer has many other benefits, including larger root biomasses, better absorption of carbohydrates and CO2, and the ability to deliver higher amounts of carbon from crop residues.
- A wide variety of extensive microbial life allows for the sequestration of a variety of carbon forms, causing increased mineralization, the transition into nitrate nitrogen and other fertilizers, and long-term storage of these carbons in the soil, which makes uptake by plants when needed much easier.
- Indeed, a 66% increase of OC (Soil Organic Carbon) in less than 6 months is, from what scientists say, something that should normally take upwards of 10 years to achieve.
- Increasing soil microbes on a scale this large or of comparable magnitude is impossible with any other product or technology on the market today.
INTRODUCTION:
WHAT IS SOIL POLLUTION?
- Soil pollution is caused when xenobiotic (man-made) chemicals or other, detrimental alterations are made to the soil environment, including toxic compounds, salts, radioactive materials, disease causing agents and chemicals. It is defined as the build-up of these toxic agents, and also as the effect that they have on the health and growth of surrounding plants and animals.
- Petroleum hydrocarbons, polynuclear aromatic hydrocarbons (such as naphthalene and benzopyrene, solvents, pesticides and lead are the most common chemicals involved in soil pollution, as well as other heavy metals.
WHAT ARE “HEAVY METALS”?
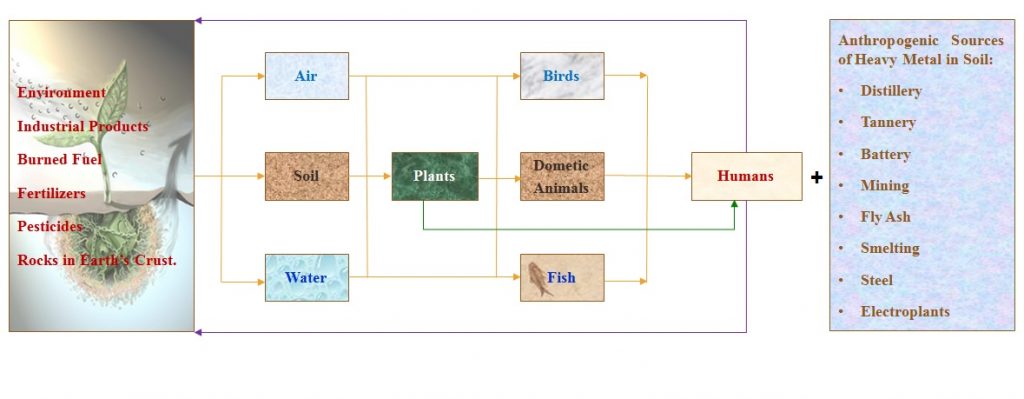
Heavy metals are defined as metals that have a density that is 5X greater than water, with an atomic weight of between 63.54 and 200.59, and about 5.0 g/cc specific gravity. Humans consume them through the food and water we eat, leading to toxicity and damage even at low levels. Unfortunately, heavy metals tend, over time, to accumulate in the food chain, including the most common- As, Cd, Cr, Cu, Hg, Pb, and Zn.
Heavy metals fall into 2 distinct categories:
1.Essential Heavy Metals:
- This includes Iron, Zinc, Manganese, Copper, Cobalt and Selenium.
- Essential heavy metals are important for the proper biological function of plants and animals, usually in very small (trace) amounts.
2.Non-Essential Heavy Metals
- Chromium, nickel and silicon, among others, are considered nonessential heavy metals as only trace amounts are found in the human body and, if they remain below the ‘threshold level’, are harmless.
- There are numerous health problems associated with long-term exposure to heavy metals, including;
qMental lapses and brain damage – Lead
qGI tract, kidney and liver damage – Cadmium
qKidney problems, skin poisoning and nervous system damage – Arsenic
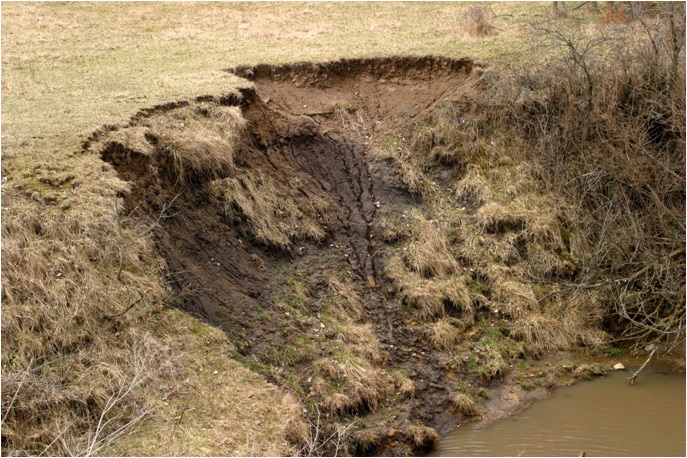
- Phytotoxicity is caused when there are high levels of heavy metals found in the soil. This metal toxicity then causes several other problems, including poor plant growth, poor soil cover, greater wind erosion, higher soil runoff and metal mobilization, especially due to the airborne spread of metal contamination by dust.
WHAT ARE THE MAIN SOURCES OF HEAVY METALS?
- The use of synthetic products such as lead-based paints, pesticides and batteries in manufacturing.
- Waste from both municipal and industrial sources.
- Waste from mining projects.
- Large, accidental spills of heavy metal laden liquids
- The sediment that comes from treatment of waste water
- Solid waste treatment pants and the leachate they produce
- Acid rain
- Any type of nuclear waste.

REGULATORY LIMITS FOR HEAVY METALS
| SOIL CONCENTRATION RANGES AND REGULATORY GUIDELINES FOR SOME TOXIC METALS | ||
| Metal | Soil Concentration Range1(mg kg-1) | Regulatory Limits2(mg kg-1) |
| Pb | 1.00 – 6,900 | 600 |
| Cd | 0.10 – 3.45 | 100 |
| Cr | 0.05 – 3,950 | 100 |
| Hg | <0.01 – 1,800 | 270 |
| Zn | 150.00 – 5,000 | 1,500 |
| 1 Riley et al., 19922 Nonresidential direct contact soil cleanup criteria (NJDEP, 1996) | ||
WHAT ARE THE TRADITIONAL SOIL REMEDIATION TREATMENTS?
- Unfortunately, when large areas of soil are contaminated and need to be treated, the expense is quite prohibitive, even if performed in situ, or on-site. Ex situ (off-site) is even more expensive, since the soil must be removed and then treated at another location.
- These treatments include:
oLong – term monitoring with vitrification
oExcavation, transport and landfilling, with vitrification
oTreating the soil chemically and recycling the contaminats
oElectrokinectics with vitrification
oPhytoextraction with vitrification
- It is also unfortunate that, once heavy metals are introduced into a soil environment, they will remain there unless physically removed. Unlike most carbon-based molecules, which are organic, heavy metals do not degrade over time, with the exception of selenium and mercury, both of which can be volatilized by microorganisms and transformed.
HEAVY METAL SOURCES, AND CYCLING, IN THE ECOSYSTEM (SOIL – WATER – AIR)
WHY BIOREMEDIATION IS A BETTER SOLUTION:
- Using microbes to remove environmental pollutants (and also prevent pollution from occurring) is called bioremediation, and leads to their safe release back into the environment.
- The same biological process is used to immobilize heavy metals and other inorganic pollutants in the ground, soil, water and sludge.
- The most cost-effective of the processes is phytoremediation, as the biological process behind it is solar-driven, reducing the cost 10-fold over other, engineering-based methods. This is especially true since the phytoremediation process can usually be carried our in situ, reducing exposure to humans, wildlife and the environment much better and more cost-effectively than soil washing or burning, excavation, pump-and-treat systems and others.
POTENTIAL PHYTOREMEDIATORS – GRASSES AND MUSHROOMS:

- Producing an ample biomass of 4000 to 500 lbs DM/A, forage seeds grow from 5 to 12 feet in length and have slender, long leaves and active root systems. They can produce up to 18000 lbs DM/A of biomass with the proper cutting and moisture in fertilized soils,
- As quickly as 5 days after germination, forage seeds begin to exude sorgoleone from their roots, an allelochemical as strong as some synthetic herbicides even at extremely low concentrations. Other natural compounds, such as nematicides, are also produced, suppressing nematodes and other pests.


PHYTOEXTRACTION
- Also known as Phytoaccumulation, Phytoabsorption, or Phytosequestration, phytoextraction occurs when heavy metals and organic compounds are extracted and/or translocated using the roots of specific plants.
- Since the plant’s roots act as the metal aggregators, the rate of phytoextraction depends how deep said roots extend into the soil.
- Hyper-accumulator plants, or plants that can store 0.01% to 1% dry weight of particular metals in their airborne parts, are specifically utilized in this process.


PHYTOSTABILIZATION
- Some plants have the unique ability to absorb and volatilize certain metals/metalloids, which is what this process relies on.
- Here, toxic elements are absorbed by the roots and then converted into non-toxic forms, including IIB, VA and VIA of the periodic table (specifically Hg, Se and As) which are then released harmlessly into the atmosphere.


PHYTOVOLATILIZATION
- This technique relies on the ability of some plants to absorb and volatilize certain metals/metalloids.
- Some element ions of the groups IIB, VA and VIA of the periodic table (specifically Hg, Se and As) are absorbed by the roots, converted into non-toxic forms, and then released into the atmosphere.

PHYTOVOLATILIZATION
- Using phytovolatilization, heavy metals and radioactive elements in particular are absorbed, concentrated and precipitated through their root system, which is usually hydroponic. This is best accomplished with plants that have a large root biomass or a surface that is larger and lends to better absorption and accumulation capacity, and plants that have a higher tolerance to contaminants. Effluents are then filtered by the roots (rhizofiltration) and various other plant organs, where they are both absorbed and concentrated.
- Both biotic and abiotic methods work well, and are very effective in absorbing and processing contaminants
- This can also be done on the surface of water using a hydroponic method as, in this technique, more root surface is in contact with the water.
USING FORAGE SEEDS TO REMEDIATE THE SOIL:

- Producing an ample biomass of 4000 to 500 lbs DM/A, forage seeds grow from 5 to 12 feet in length and have slender, long leaves and active root systems. They can produce up to 18000 lbs DM/A of biomass with the proper cutting and moisture in fertilized soils,
- As quickly as 5 days after germination, forage seeds begin to exude sorgoleone from their roots, an allelochemical as strong as some synthetic herbicides even at extremely low concentrations. Other natural compounds, such as nematicides, are also produced, suppressing nematodes and other pests.
THE IDEAL COMBINATION FOR HEALTHY CLEAN SOIL:
FORAGE SEEDS + SOIL REMEDIATION + NATURE VIGOR + CARBON LIQUID
| FORAGE SEEDS | SOIL REMEDIATION | NATURE VIGOR | CARBON LIQUID |
| •Heat loving•Excellent emergency forage back-up•Potential phytoremediators
•Low cost due to use of solar energy |
•Extracts heavy metals using special microbes•Breaks down and consumes hydrocarbons and other pollutants•Reduces surface runoff
•Reduces contaminant leaching and mobilization. • |
•Significantly increases fertilizer, chemical and amendment efficiency•Nutrients in soil chelated•Yield increase up to 30% greater
•Phosphorus, sulfur, nitrogen and other nutrient uptake increased •Minerals better solubilized •N, P, K, S and Zn stored naturally •Biological activity greatly stimulated •Drought resistance increased and water usage decrease through improved capacity of water-holding. |
•Efficient remediation of salt in soil•Soil compaction greatly reduced•Buffering capabilities increased
•Water and nutrient availability increased dramatically •Healthy microbial activity increased |
MICROBIAL/OIL ASSAY SYNOPSIS:
| Oil Samples | Alkane BioRem | H2S Elimination | Microbial Growth on Alkane | Globule Formation |
| 1454 | +++ | +++ | +++ | +++ |
| 1049 | +++ | +++ | +++ | +++ |
Legend: + = Week Activity ++ = Moderate Activity +++ = Strong Activity
RESULTS:
Alkane bioremediation assay results :
Using an alkan remediation assay, reduction and remediation of hydrocarbons in a heavy oil sample was demonstrated by our petroleum microbes. After incubating in petri plate for 72 hours, our microbial coating began to form colonies around and throughout the heavy oil hydrocarbon substrate that was present. This demonstrates that alkane, as well as more complex hydrocarbons, were being digested and metabolized by the microbial colonies that were formed. In both oil samples the microbial colonies demonstrated significant growth.
Hydrogen Sulfide Control Assay Results:
Here we see an H2S side-by-side comparison between 2 heavy oil samples, one treated with microbes and the other untreated, with the black color coming from the formation of H2S due to the sulfate reducing bacteria (SRB) in the hydrocarbon substrate.
In both of the microbially treated samples (on the right), the SRBs have been eliminated, and the microbial profile fundamentally shifted away from H2S.
Both of the treated samples showed the elimination of H2S and the effective control of SRBs.

Microbial Growth on Alkane Assay Results:
In this test, the oil samples were split into untreated control samples and treated samples, whereafter the treated samples received an inoculation of 7 million CFU/ml of microbes. Over the course of the following 6 days readings were taken via spectrophotometer to measure the absorbance values of the samples, which demonstrated a disturbance in wavelength through the test tube, suggesting increased microbial growth concentrations that were, in effect, interfering with spectrophotometer’s light pathway.
Throughout the 6 day period, starting on day 1, there was a significant increase in the treated oil samples versus untreated, including microbial mass, and color (which darkened). The results showed that carbons from the hydrocarbon chains (as measured by globule formations) were being utilized and metabolized by the microbes, with a resultant smaller hydrocarbon chains and more early moveable oil.
à Table of Treatment Below:
| Treatments** | Day 1 | Day 2 | Day 3 | Day 4 | Day 5 | Day 6 |
| Untreated 1454 | 1% | 2% | 1% | 1% | 1% | 1% |
| Microbial Treated 1454* | 15% | 35% | 65% | 85% | 98% | 100% |
| Untreated 1049 | 1% | 2% | 1% | 1% | 1% | 1% |
| Microbial Treated 1049* | 16% | 33% | 68% | 82% | 96% | 100% |
* Increasing Bacterial Absorbance readings equate to increasing micorbial growth on hydrocarbons as a carbons and food source.
** Maintained at 190oF
DATA ON GLOBULE INFORMATION:
- Both microbial treated samples demonstrated significant small oil globule formation.
- The results show that healthy bacterial action is the key to improved oil recovery in heavy oil reservoirs, resulting in an oil surface area that is greatly increased.
- It must be noted that this process, like any other, is not immediate, but will take time dependent on various factors, including temperature and environment.
- The alkaline degradation pathway was shown to further reduce oil globules through microbial action.
GLOBULE INFORMATION:

VAROUS APPLICATION METHODS:
There are several application methods that work well, including soil drenching, blending into irrigation lines, back-pack spraying and furrowing.
- Best practice application is 4 L per hectare
- Application at pre-planting or planting is advised, with a reapplication post-germination or at 4 to 6 weeks.
- In order to allow chelation and the removal of metals and soil contaminants, a Post Application of soil acidifier is recommended.
- Product can be blended with both liquid and dry fertilizers as well as soil amendments
- It is recommended to agitate product well before application
- Store product in a cool, dry location
- Close cap tightly when being stored and not in use